무역, 해외 시장 모니터링, 리서치 및 분석.

레이블이 Economy인 게시물을 표시합니다. 모든 게시물 표시

2020/10/19

Signs of recovery in Singapore after the onset of COVID-19.

Singapore economic report, which had recorded the worst economic growth rate ever recorded in the second quarter plunging about 13.4% compared to the same period last year and negative 41.2% compared to the previous quarter. However, economy indicator showed a significant improvement in the third quarter.

According to CNBC on 13th, the Ministry of Trade and Industry (Singapore) reported that the gross domestic product (GDP) in the third quarter decreased by 7% compared to the same period last year. Compared to the previous quarter, GDP increased by 7.9%. Still, negative growth continued in the third quarter following the second quarter, but the decline was noticeably weakened.


The Ministry of Trade and Industry pointed out, "Better performance of Singapore's economy in the third quarter seems to be the result of the step-by-step reopening of the lockdowns that was partially enforced by the Singaporean government."

In addition, it is interpreted that the 2% increase in GDP of the manufacturing sector compared to the same period last year had a big impact on Singapore's economy rebounding in the third quarter. The manufacturing sector's GDP declined 0.8% in the second quarter.

However, analysts indicated that that it will be difficult until next year for the Singapore economy to enter a recovery phase, with the fear of another pandemic cycle might recur throughout Southeast Asia.

 Source

https://www.straitstimes.com/business/economy/spore-economy-shows-signs-of-recovery-in-q3

Types of Yield Curve Risk: Flattening and Steepening.

There are two types of yield curve risk: steepening and flattening. Steepener means the widening of yield curve. Conversely, a situation in which the yield curve is flat is called flattener.

A yield curve is a line that interest rates of bonds having equal credit quality but differing maturity dates. The slope of the yield curve gives an idea of future interest rate changes and economic activity. In general, bonds have a lower interest rate for short-term such as treasury bills and higher interest rates for long-term bonds.

When there is an expectation that the economy will improve in the future, a curve steepening will occur where short-term demand increases and long-term demand decreases. On the contrary, under the forecast that the economy will slow down, the spread in long-term yields and short-term interest rates narrows, leading to curve flattening. This is the reason curve flattening is regarded as a precursor to the economic downturn.

Curve steepening and flattening are divided into two categories, bull(cut policy rate) and bear(raise policy rate).

Bull steepening is a phenomenon in which short-term interest rates fall due to possible policy rate cuts, leading to a curve. For example, when Federal Reserve is likely to lower the interest rates, the expectation of bull market occurs hoping that the economy will recover, and the stock market will be bullish. (interest rate cuts -> low short-term interest rates -> more yield spread

Bear Steepening refers to widening of yield curve caused by rising of long-term interest rates. When the expectations for break-even inflation rises, Federal Reserve tends to hike its policy rates to slow the price from skyrocketing. Investors will sell their fixed-rate long term bond to seek more attractive assets which offer higher interest rates. This will result to bear steepener since investors will likely pursue shorter maturity bonds. (inflation expectation -> interest rate increase -> investor sell long term and buy short-term bonds -> more yield spread)

Bull flattening refers to a flattening curve due to a fall in long-term interest rates. It happens when the inflation rate expectation is low so that investors find more safe-haven assets. For example, Japan had experience of deflation and investors have been purchasing bonds even though they offer low interest. (Low inflation rate -> investors buy assets that are higher than inflation rate)

Bear flattening refers to a flattening curve due to a higher short-term interest rate. The yield curve is to flatten as short-term rates start to ratchet higher in anticipation of the Federal Reserve embarking on a tightening monetary policy.


Source 1: Global Monitor

Source 2: Investopedia

2020/09/23

Pandemic only unleashes inequality between the rich and the poor.

The United States was the lead of the world in financial asset growth last year thanks to tax cuts and a boom in the stock market, but the distribution of wealth was more unequal than any other country. 

According to the annual tally which Allianz, the German insurer which holds world stocks, bonds, cash and other assets, showed that poor countries are no longer able to follow the wealth of advanced countries. For the first time since 2000, the number of people considered middle class worldwide has declined when measured by their financial holdings. 

And the world's super rich are becoming more and more rich. The top 1% own 44% of their financial assets, and their shares are increasing. “The super rich do indeed seem to be moving further and further away from the rest of society,” the Allianz study said. 

The pandemic only exacerbates the gap between the poor and the poor. The decline in global trade will be the biggest obstacle to developing countries, and the poor suffer more from the burden on the health care system and public schools. 

Assets per capita in the United States increased by more than 13% in 2019 to $245,000. The United States was ahead of Switzerland and Singapore in per capita.

Source : NYT

https://www.nytimes.com/2020/09/23/business/united-states-is-the-richest-country-in-the-world-and-it-has-the-biggest-wealth-gap.html

2020/09/15

What makes oil prices volatile? History explains.

Crude oil prices had many rise and fall in history. After crude oil attracted media attention in the 1850s, the price now has been lower than the average price. Energy and petroleum expert, Daniel Yegin indicated that crude oil could be the most popular speculative option for investors to bet against the volatility. 

Rise of Crude Oil

Crude oil was the first discovered by Edwin Drake and was industrialized by John D. Rockfeller. The oil started to be used in many different areas. By 1890, Standard Oil Co. controlled almost 88 percent of the refined oil flows in United States which triggered to face antitrust legislation that restricted the market monopoly. In March of 1908, geologist George Bernad Reynolds started to explore other than U.S. and founded out the possibility the oil could be discovered in Persian area (which is now considered Iran). 

As crude oil production places increased, the supply of crude oil also surged. According to the law of supply and demand, demand remains the same, but when supply increases, prices go down.

Automobile

Oil prices, which had been cut in half due to increased supply in oil, doubled again in around 1910. This is the time when Henry Ford installed first moving assembly line for the mass production by applying the conveyor belt system to the automobile plant. The innovation contributed automobiles to be widely popularized. Demand for crude oil soared as demand in automobile fueled.

WWI and Great Depression

However and the supply of crude oil became unstable due to World War I, which pushed the oil price higher. With the onset of the Great Depression, oil prices fell again due to the loss of demand and more countries started to extract more oil. In the early days of oil market, short-term prices were determined by supply and demand, and in a longer-term, the rise of crude oil supply made the prices fall gradually and steadily. 

Aramco and OPEC

However, things got different after significant amount of oil was discovered on March 4, 1938. The name Aramco (short meaning of Arabian American Oil Company) started to be famous in the beginning of 1944 and the company reached the milestone of supplying 500,000 barrels a day in 1949 and later, one million barrels a day in 1953. As Aramco had a domination of global oil market in 1960 which later came up with foundation of Organization of Petroleum Exporting Countries. OPEC’s objective of formation is “to co-ordinate and unify petroleum policies among Member Countries, in order to secure fair and stable prices for petroleum producers.” 

Wars in Middle East

However, political issues happened in 1970s. In 1973, oil-producing Arab nations cut off supply of crude oil to U.S in retaliation for supporting Israel in the Yom Kippur War ($24  $56). In 1979, Iranian revolution resulted in sharp drop in oil production which lifted oil price from $56 to $125. After that President Reagan controlled the price of oil to $26 from $113 in 1986 by abolishing last price controls on U.S. produced oil. Gulf War lifted $34 to $77 in August 1990 when Iraq invaded Kuwait. Later the price fell back to $37 after U.S. military success in removing Iraqi forces that Saddam Hussein regulated. 

Expansion of Emerging Market

From 2004 to 2007, oil prices continue to rise and reach $74 because emerging economies such as China, India, and Southeast Asia spurred industrialization, resulting in enormous energy demand, while the supply remained stable. It was because oil-producing countries did not increase production to have more gains by benefiting high oil price. 

Great Recession

However, in 2007 and 2008, series of event such as Venezula cutting oil production to Exxon Mobile, slow recovery of Iraq’s export on oil, labor strikes in Nigeria and the U.K.’s North Sea oil fields, and Mexico’s decline in oil. The price of oil reach in $118 in December 2007, and peaks $165 in mid 2008s. However, after weak demand of oil during great recession caused by financial crisis, the price sank till $50s. 

Shale Revolution

Recovery from global economic crisis made oil price rebound to nearly $95 until huge increase in shale gas production. The revolution of fracking the oil led oil price plummet in 2015. It was a strategy to increase the market share in the long run, bearing short term low oil price. Afterwards, OPEC reduced production again until 2018, and oil prices recovered.

COVID-19

In April of this year, Western Texas Oil's May futures price hit an unprecedented oil price of negative $37.63. It means that the future price (May) for crude oil has fallen to negative as of April. The price of crude oil was too low that the seller had to give more premium to the buyer. The demand for crude oil dropped sharply as COVID-19 spreads globally. Shutdown of factories and lockdown sharply reduced oil but supply remained the same, creating a huge gap between supply and demand. This situation is regarded as contango where future price of commodity is higher than the sport price. (Backwardation has opposite meaning)

Warehouses that handle oil inventory were insufficient, which increased more on storage fees. However oil producing countries did not reduce production. (China used it as chance to buy crude oil cheaply) OPEC+, a group of oil producing countries no matter they are in OPEC or not, failed to reach an agreement to reduce production. Rather than cutting production, Saudi Arabia and Russia increased their production, and the rest of the countries were also struggling to increase their production, which made refinery companies in danger. 

If the price of crude oil went down too much, it would be a big problem for each countries. In particular, Russia was worried American shale oil would take over market share. Afterwards, with the agreement to cut production gradually, the oil price slowly recovered. However, anxiety still remains since oil cut tapering puts pressure on OPEC+’s economy such as unemployment and GDP. 

Summary

Oil prices move according to supply and demand in this way and it is also closely related to international political abuse. 

• Increase in oil-producing countries

• Significant increase or decrease in demand for external reasons such as political and economical issue.

• Rise of industries that replace crude oil such as shale gas

Future

The shifting to the energy industry also has an impact on crude oil market in the future. Alternative energies such as solar power, electrical energy, hydrogen fuel, and nuclear power, are threatening the crude oil market. Will they change the frame? Well nobody knows for sure, but decline in need for crude oil is now on process.


Source

https://www.wsj.com/articles/oil-prices-drop-on-faltering-recovery-in-demand-11599562101

https://www.investopedia.com/history-of-oil-prices-4842834

https://courses.lumenlearning.com/suny-hccc-worldhistory2/chapter/the-discovery-of-oil-in-the-middle-east/

https://www.businessinsider.com/the-history-of-saudi-aramco-timeline-2017-11#aramco-gradually-increased-its-production-throughout-the-course-of-the-1940s-reaching-the-milestone-of-500000-barrels-per-day-in-1949-11


'Real' yield is the core of market mover.

Economists regards real yields as a market mover in this summer. Real yields are linked with the yields on Treasury inflation protected securities, or TIPS. They can be measured as alternatives by looking at the yields on TIPS. 

"TIPS is a type of Treasury security issued by the U.S. government that is indexed to inflation in order to protect investors from a decline in the purchasing power of their money. The principal value of TIPS rises as inflation rises while the interest payment varies with the adjusted principal value of the bond. The principal amount is protected since investors will never receive less than the originally invested principal." - Investopedia

*Nominal yield = Real yield + (break-even) inflation rate 

*Real yield = Nominal yield - (break-even) inflation rate

*Break-even inflation rate = Nominal yield - Real yield

For example, if an investor buys an ordinary 10-year treasury notes, he can have possibility to lose about -0.9% in annualized basis since nominal yields on 10-year treasury notes is 0.67% and break-even inflation rate is 1.65% according to Federal Reserve Bank of St.Louis. 

However, it is very difficult for the nominal interest rate to fall below 0.10%, since interest rates on excessive reserves(IOER) on Fed is set at the target. If yields on Treasury notes falls below 0.10%, banks may be reluctant to buy any bond; they will rather lend it to the Fed. (The bond interest rate, the market rate, the yield on treasury notes, etc. are all applied in the same concept)

Of course, not everyone can deposit at a 0.10% interest rate in the Fed, so it would not be impossible for nominal interest rates to fall below 0.10%. Financial institutions, which are not eligible to save their capital to the central bank, must somehow keep large amounts of cash in a safe place and keep them in line with their debt structure for quite a long time; there is no alternatives than government bonds. But anyway, assuming that 0.10% is the primary lower limit of nominal interest rates, real interest rates are principally determined by (break-even) inflation rate.

For example, if the nominal 10-year treasury note yield falls to 0.10%, break-even inflation rate in the bond market will rise to 2.10% then the real return on the same maturity falls to -2.0%.

In August, real yields were likely to reach the downward limit. When the minutes of the FOMC discussions were released in July, the US mid- to long-term treasury bond yields jumped. The yield on TIPS has risen even more. Naturally, the government bond market's expected inflation declined. In other words, a dis-inflationary movements were unfolded as the financial market environment tightened after the announcement of the FOMC minutes. The dollar jumped and the gold price plummeted.

The financial market had been expecting the FOMC to clarify its forward guidance on zero interest rates and more of supportive asset purchase policies on upcoming September. Keeping zero interest rates until inflation exceeds the 2% target was almost certain. 

Yet, Fed only suggested the time to clarify the guidance on the path of interest rate policy as "at some point." It became unclear that Fed will ease the monetary policy this September. There could be no lower interest rate, and even if the Fed alone does something more, it won't help the unemployed who worked in restaurants, bars, hotels and theaters. The absence of Fed's leadership of economic stimulus eventually produced graphs of lowering break-even inflation rate whereas real yields rise slightly.

Nonetheless, Fed announced about monetary policy plans, remaining federal funds rate near zero until average inflation reaches and remains over 2 percent "over time".  Please see my blog down below.

https://techongstudy.blogspot.com/2020/08/review-of-monetary-policy-strategy-fed.html

This overall means owning Treasurys are not considered attractive since the stocks, gold, or corporate bonds can be an alternative that is likely to have more potential positive return. After Fed's super dovish monetary policy which is also supported by U.S. Treasury's fiscal policy, real yields have turn negative due to the short term interest rate near zero. This factor has encouraged investors to take risk-on mode and expose themselves to stock market, commodities or riskier trading field.

There are several reasons that real yields matter to the consequences below:

After Fed cuts FFR to zero due to pandemic hit, negative real yields were purposely driven, since the central bank has been buying Treasury bills and has given the signal targeting above 2% average inflation target(AIT) over time. The stance of Fed has given the effect of capping Treasury yields since long-term yields tend to follow short-term interest rates. This has given investors more confidence that Fed will allow inflation for long period of time, so the real yields have dropped.

Stocks & High yields

For the Fed, low real yields aren’t the only weapon for hiking asset price. For the anticipation of Fed's intervention on economy cushion, yield spread between Treasury  and investment-grade corporate bond is below its 10-year average, despite the pandemic. It helped companies to issue more amount of bonds in that short period of time, which enabled companies to keep on paying the workers and investments. Stocks also skyrocketed by negative real yields.

Dollar & Gold

Lower yields drop lays consequences on weakening dollar. The interest rate is the price of money. The quantity of money increases and decreases in the movement of the interest rate. When the money is overly supplied, then the value diminishes putting the price downwards. When the real yield of U.S. is higher than other countries, then the dollar gains its strength.

Thus, the decline of in U.S. real yields compared with German real yields has helped strengthen the euro against the dollar. Similar to bonds, gold is an asset that investors seek for safety. It also tends to soar during acceleration of inflation. because it then takes more dollars to purchase the same amount of the precious metal. Please see my blog below.

https://techongstudy.blogspot.com/2020/08/can-gold-and-silver-be-considered-as.html


Source: Global Monitor, WSJ 

https://www.facebook.com/globalmonitor.kr.1?epa=SEARCH_BOX

https://www.treasury.gov/resource-center/data-chart-center/interest-rates/Pages/TextView.aspx?data=realyield

https://www.wsj.com/articles/real-bond-yields-help-explain-surprising-market-moves-11600090704?mod=markets_lead_pos3

2020/09/08

International trade tips for individual resellers (How global trade works)

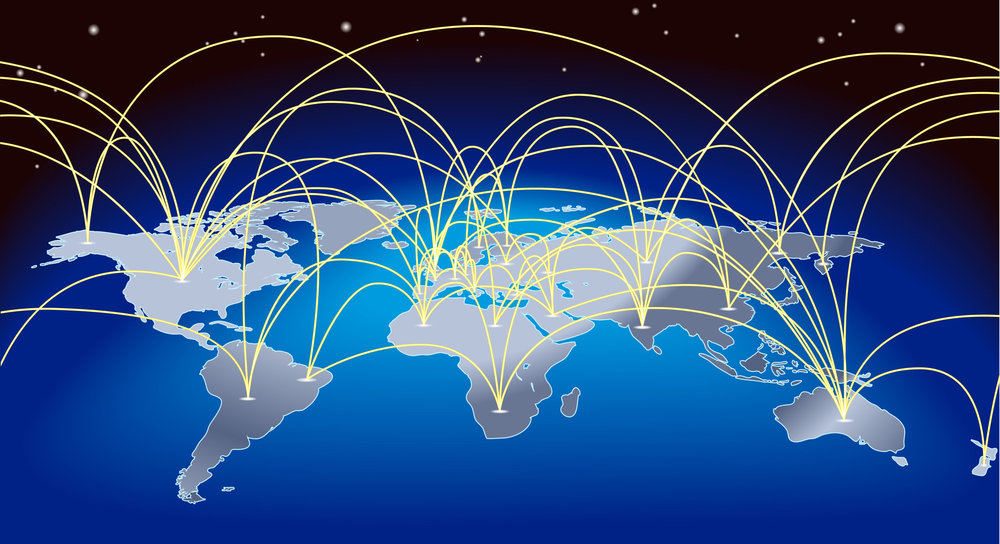
World trade is becoming more simple and easy.
Trading globally does not mean full 40’ standard high cube container volume transaction between two conglomerates. Until 2000s, trade had been a very high entry barrier. Massive budget was essential to win a contract from other party by arranging an international business trip or attending an international fair. However, as the internet develops, more information was shared globally. Upgrades on finance technology has helped to reduce the burden of traditional global payments such as telegraphic transfer by banks, letter of credit, or collection basis (D/A, D/P). The development of logistics services of e-commerce platforms has made small volume trade easier. Anyone can participate in global trade field without substantial expenses. To know more about the process please check the factors below.


Trade documents
The papers contains payment and shipping-related documents issued directly or indirectly by importers and exporters, mostly in the course of paying to exporters and delivering goods to importers under a trade contract.

Trade documents are mainly composed of Bill of Lading (B/L) when the products are about to be shipped, commercial Invoice (C/I), and packing list (P/L) from consignor’s side. purchase order (P/O) or letter of intention (LOI) is issued by buyers when ordering, proforma invoice (P/I) is written by exporters when presenting the quotation. Sometimes certificates of origin (C/O), material safety data sheet (MSDS), etc. are needed during the process of custom clearance and quarantine sanitation. When the products are delivered by air, then the shipping company issues airway bill (AWB).
 

Payment
There are various payment methods. The payment can be through bank using telegraphic transfer (T/T) service, or letter of credit (L/C) when exporters are not reliable enough to pass the goods safely door to door, and collection base such as document against payment or acceptance. As fintech improves, paying through online became one of the means for global trade. Paypal, Payoneer, Union Pay, etc are the example of finance technology.

Then what method should buyers choose to do the payment? Well it depends, if small orders, then I prefer Paypal, but if the order increase, then telegraphic transfer is another method. When selecting payment as Paypal, then 100% payment in advance is recommended since the commission fee is high (approximately 3%) and the orders are small. If order starts to get bigger, then I recommend doing telegraphic transfer. Buyers can pay 30%-50% of down payment for safety, and when the products are ready to be shipped, the rest can be paid afterwards. Remained balance payment can be decided depending on the situation such as an issue of check B/L or other materials that can prove the safety of shipment.

If the seller is extremely unreliable, then I recommend L/C usance or D/A. In cases of most frontier countries, advising bank can be untrustworthy as well, T/T after 00 days of invoice might be the safest method during international trade. Payment method should be negotiated carefully.
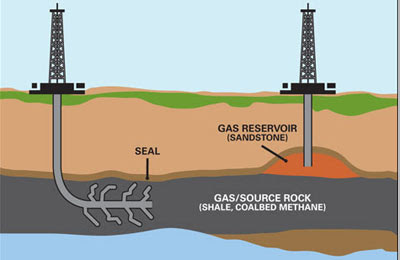


Shipment
Delivery of goods varies on gross weight and volume of the product.

1) Air: couriers such as Fedex (TNT), DHL, UPS, EMS
Shipping cost is calculated on the volume and gross weight. Larger amount the consignee import, more charges it would cost. It is recommended to small amount orders since the cost can be extremely high that buyers cannot afford and the delivery lead time can be shortened. (It takes about 3-5 days in most of the countries) Most of the packings are in cartons or boxes.

2) Ocean: logistic (shipping) companies
Shipping cost depends on cubic meter (CBM) and gross weight. CBM is the size of the volume (length x width x height). If it is over 1 CBM, then the shipping cost will be cheaper. Most the transaction goods are packed in pallet when buyer prefers less than container load (LCL), or full container load (FCL) when total amount is over 10 pallets. Lead time can take from 2 weeks to more than a month depending on the distance.


Incoterms 2020
The terms are used to specify who is in charge of the shipping cost and custom clearance fee. It also includes who is applying for the insurance during the shipment. There are total of 11 terms, three terms are used widely during global trade.

EXW (Air)
It refers to the sellers (or also regarded as shippers) handing over contracted product from their factory or warehouse to the buyer (or also considered as consignee). The seller has minimum obligation, on the other hand, buyer covers all costs and organizes transport. (Buyer takes responsibility from seller's factory) Convenient condition for exporters who are not familiar with trade transactions since buyers takes own risk and cost for carrying out all the trade process. EXW is proceeded when seller is in A's position and buyer is in B's position.

FOB (Ocean)
It is the most commonly used condition with CIF in practice. The divergence of risk and cost ends when the seller puts the goods on board of the buyer's nominated ship. Subsequent risks and additional costs are all up to the buyers. They have the right to sign the nomination of vessel (frieght forwarder) and the contract of carriage, and at the same time bear all costs such as freight and insurance to the destination (port).

CIF (Ocean)
Seller's Cost: CFR + Sea Insurance Fee
Under the CIF terms, if there is no agreement for insurance between each other. The seller must pay for insurance. When signing an insurance contract, the policyholder and the insured are the sellers, but after the transaction begins and the goods are shipped, the insured becomes the buyer. The rules dealing with the rights and obligations of the parties under the CIF are the Warsaw-Oxford Rule-Waluso-Oxford Rules. If CIF is changed to a combined transport method, it becomes CIP.

To see more Incoterms 2020, please check my blog.


Custom Clearance
It depends on the countries, since they have different laws and regulation. There are several reasons for it; to protect their manufacture industry or to screen the products’ safety when their nation use it. To say in common, cosmetics, foods, medical cares, electronics with electromagnetic waves are the subject to be examined during custom clearance. Small quantities of samples are not the problem to import or export. On the other hand, mass amounts of products may encounter problem when entering custom regulations. Even though the products are extremely safe in manufacturing countries, consignees still need to acquire foods and drugs administration (FDA).

To proceed FDA, exporters can help by sending ingredient list or MSDS. If importers want to reduce tariffs, then C/O is required. If buyers do not like to involve in complicated process, or manufacturing companies do not want to reveal their ingredient, there is method of shipping separately by dividing partially in different consecutive days. Using countries which has less custom regulation is another methods, such as Hongkong, Singapore, and Dubai.

2020/09/05

The Global Economic Crisis from China Has Started

“There is an opportunity that comes once every 100 years"

The global economic crisis from China has already begun, and a book has been published in Japan by two renowned economist, Miyazaki and Tamura, claiming that this crisis has an opportunity that comes once every 100 years. The new book “The Global Economic Crisis from China Has Started” explains the cause of the crisis from China, which will bring more shock global financial crisis 2007-2009, and suggests concrete method to find opportunities in this crisis. The global economy in 2020 is likely to be a more difficult year than ever in history. It is because there is a high possibility that the economic crisis caused by inflation from China, which has been constantly raised so far, will become a global economic crisis in the aftermath of the US-China trade war.

Unlike what appears to as trade war due to U.S. trade deficit, the essence of the U.S.-China trade war is the war of technological hegemony. In the empire of IT or IoT represented by tech companies so called MAFAA (Microsoft, Apple, Facebook, Alphabet, Amazon), VS AT (Alibaba, Tencent), it is  a fight to take control of technology hegemony. U.S. cannot afford to let China dominate such an important future industry. However, China also has to revert their industry from traditional manufacture industry which produces little profit to the high value-added industry.


China 2025 (Smart Manufacture+) is the best project for China from avoiding in debt-ridden environment and raise its GDP. The problem is that Japan and South Korea are the most affected countries in the U.S.-China trade war over global economic hegemony. Korean investors must come up with strategic countermeasures in case the friction between the U.S. and China continues. This is to minimize the damage and take advantage over opportunities. The book mainly focuses on the risk, which is steadily arising from U.S. and China trade disputes such as China's OBOR (BRI) policy and China Manufacturing 2025, and internal issues in China.
See my blog: https://techongstudy.blogspot.com/2020/08/china-wants-to-revitalize-its-domestic.html

Fighting for techno-hegemony
The background of the trade war began with a number of complicated reasons, in which China has made rapid progress in attracting technology and capital from around the world to become a technology powerhouse that surpasses the U.S. based on a huge trade surplus. As, Chinese exports have been blocked due to the trade war, China is concentrating its domestic economy mostly in technology area. The U.S. government found that it used all sorts of methods, such as corporate espionage and acquisition of foreign companies, such as technology theft and human resources transfer. Recently, as China's ZTE and Huawei (Tik Tok recently) have begun to outpace U.S. technologies in semiconductor and telecommunication technologies, which are key technologies in the future. The dispute between the U.S. and China has intensified as U.S. has pressured China in the form of competition for technological hegemony. This is said to be the same in both partisans (democratic and republicans).

Chinese leader Xi Jinping will never end his presidency by extending his term indefinitely in the National Assembly in 2018. China is expanding its belt and road initiatives with its huge trade surplus capital against the U.S. as a weapon. Before Trump administration, many of the Wall Street-linked relatives and politicians who sought wealth through 'China capital'. After entering the Trump administration, China's prestige grows and threatens the United States. The way to stop it at the source is to intervene in Chinese trade surplus that attracts enormous wealth of China.

Belt and road initiative
The book provides detailed examples of the problems of China's RBI development project. Common problems are that China lends money to emerging and frontier countries through RBI. Projects are monopolized by Chinese companies, major equipment is imported from China, and Chinese laborers are used. The debts leased to developing countries are marked in dollars and carried by the local government. If the debts cannot be paid off, China confiscates the infrastructure or land. The United States recognizes the seriousness of the matter, and Vice President Pence warns of this plan as a 'debt trap'. China is even building a military base (Djibouti, Africa) through this project. In the one-on-one plan, there is a new version of Silk Road intention to secure crude oil in preparation for an upcoming military conflict. Countries that are trapped in debt by OBOR are Pakistan, Sri Lanka, Cambodia, Maldives, Myanmar, Bangladesh, Malaysia, Indonesia, Nicaragua, Venezuela, Thailand, Nepal, Angola, Madagascar, Uganda.

RMB and inflation issue
Issuing more RMB than US dollar reserves, can lay concerns about inflation sooner or later. On the one hand, the United States and Japan support China appropriately, fearing the impact on the world if the Chinese economy collapses. Mainly Japan plays this role because Japanese policy interest rate is negative, so most of Japan's funds are invested abroad, and are borrowed from China through Panda bonds.
"A Panda bond is a Chinese renminbi-denominated bond from a non-Chinese issuer, sold in the People's Republic of China. The first two Panda bonds were issued in October 2005 on the same day by the International Finance Corporation and the Asian Development Bank." - Wikipedia

Japan is also well-known in having massive fiscal deficit, but the authors say that Japan's debt is near zero according to the balance sheet. (Japan is the biggest net creditor country in the world) Unlike the high debt rates of the U.S. and China, Japan has a high savings rate, so financial assets such as deposits and stocks are said to be three times the GDP. (Most of debt-holder is BOJ and its nation) 

Covid-19
Currently, China is not only facing pressure from the United States, but also neighboring countries such as India. There is also internal problem in China as growing sign of dissatisfaction with the government has started to emerge and Covid-19 crisis has triggered it.

Will China collapse in crisis? Well, the paradigm of dispute has reverted from trade tariffs to national security and diplomacy problem after first U.S. and China agreement and pandemic. This book shows historical events through specific examples and data. Global investors are very exposed to the relationship between United States and China; reading this book can serve as an opportunity to seriously think about how to catch global economy trend and prepare for it.

Why is onion future price so volatile?

What makes the market volatile? 
Why is the price of asset so fluctuating?
Is it because of speculative day-trading investors?

The article of <Newsweek> in 2010, mentioned about volatility saying, "By trading vast amounts of stock at warp speed, as many as a billion shares a day, high-frequency traders gobble up fractions of cents at a time. The more volatile the market, the easier it is for them to make money jumping in and out of stocks across exchanges."

Well, does high-frequency trade affects on the volatility on the market? Ken Fisher, CEO of Fisher Investments, indicates volatility during the Great Depression. The stock market was moving upwards and downwards frequently. The reasons for market surge and stumble in short period of time were various; one of them was regarded as lack of liquidity. There weren't that many listed stocks in the market and the trading volume wasn't abundant. Information was delivered much more slowly, which hindered the fast recovery of price. Markets with low trading volumes are usually highly volatile due to insufficient liquidity and supply.

Futures traders are often referred as speculators because they bet money on future prices. There are countless reasonable motives to have future trading deals. Firms use futures contracts to stabilize the cost of purchasing in response of highly volatile commodities. Airlines buy oil futures to stabilize operating costs. Farmers use future tradings to purchase agricultural manure or compost.

Why is onion future price so volatile
If you are curious about a market without speculation, just looking at the onion future market is enough. In 1958, onion farmers claimed speculators were slashing the price of onions. Michigan Congressman Gerald Ford, who later became president of United States, believed in this claim and banned futures contracts for onions. In fact, Ford was the one who has believed in the free market. This ban is not abolished and still exists today. Ford and the farmers did not understand that speculators were contributing to providing liquidity to the market. They didn't even know that their market participation actually makes volatility less.

Onion vs Oil
If you think oil future has heavy volatility, please refer to the chart below. Onion prices fluctuate more frequently than oil prices. The range of fluctuation of onion is even greater. If the price volatility was so high, speculators would need to be invited back to the market to reduce volatility. It is foolish to ban speculation just to protect farmers.


Speculation in forex market
The exchange rate must have a sufficient amount of supply and demand to determine the appropriate exchange rate in the foreign exchange market, which is determined purely by market function, and speculative foreign exchange transactions must exist in order to secure such demand and supply. If speculative trading is prohibited and only underlying transactions are made on demand, the size of the market will not reach a certain level and as a result, the foreign exchange market's exchange rate may be distorted or the exchange rate-setting function may be lost.
For example, lets presume that only underlying transaction is on demand. When the demand of dollar is 2 million and supply is only 1 million, the currency rate will soar up in need for more supply, which will make Forex in extreme volatility.  However, when speculative transaction is traded actively, then the supply problem will be hugely diminished.

Please refer to the blog here:
https://techongstudy.blogspot.com/2020/08/what-is-exchange-rate-and-forms-of-it.html

Source: Market Never Forgets (Ken Fisher)


2020/09/01

Introduction of YCC (Yield Curve Control).

Yield curve control or YCC (sometimes called YCT) is aimed to control treasury yields at a certain target. FFR or fed fund rate is an interest rate of very short maturity and can be regarded as call rates. YCC is positioned to target at longer bonds by imposing interest rate caps at a certain rate.

When bond price soars high (remain above the floor), then central bank sells the treasury or does nothing at all. However, if the bond price fall and interest rates surge, then the central bank purchases the bond at a higher price. That can be one of the announcement effect that can let investors buy the bonds beforehand, expecting the bonds to be sold by central bank at a higher price. YCC or YCT is used to remain interest rates near zero. (It has strength of maintaining interest rate zero without expanding Fed's balance sheet)

Past week, Fed announced about monetary policy plans, remaining federal funds rate near zero until average inflation reaches and remains over 2 percent "over time".  Please see my blog down below.
https://techongstudy.blogspot.com/2020/08/review-of-monetary-policy-strategy-fed.html

However, YCC is not very easy to apply right now. In the recent economic and financial environment, the control is not a good function for 'added fuel'. Two-year treasury note yield is 16 basis point, five-year bond yield is 30 bp, and ten year of 64bp. There is no much room to pull the yields down; if needs targeting, then it should be 30 year maturity. (targeting long term has risk of austerity or tightening).

James Bullard, the CEO of St.Louis Fed is worrying about the exit of the policy. The essential target of YCC is pulling down the yields that the bonds have. When the yields remain zero with the effect and later consider about exiting from YCC, market has to prepare aftermath. (Cold turkey phenomenon) YCC is for strengthen the 'forward guidance' that Fed can do to stabilize the market, removing the panic of mom-and-pop investors or financial institution. The rise of YCC was due to the climb of long term treasury yield after Fed announce to ease money on short-term market (call or repo).

U.S. has proceeded YCC during second World War times(1940) by incurring massive debt expenditures. Mr. Bernanke mentioned yield cap in 2002 to terminate deflation cause. In 2010, Fed announced to target at around 0.1% after financial crisis. Japan adopted YCC in 2016 and Australia in 2020.


Source: Saint Louis Fed
https://www.stlouisfed.org/on-the-economy/2020/august/what-yield-curve-control

Source: Global Monitor
https://now.globalmonitor.co.kr/view.php?ud=2020090107371593171a6a872ef5_41

https://now.globalmonitor.co.kr/view.php?ud=2020090107363630891a6a872ef5_41

2020/08/17

The exchange rate system: fixed, flexible, managed float

The exchange rate system is largely divided into three types: fixed exchange rate system, variable exchange rate system, and limited exchange rate system, depending on the degree and type of flexibility of exchange rate changes.

Fixed exchange rate system (or sometimes called pegged)
The fixed exchange rate system contributes to stable economic growth by reducing the cost of exchange rate fluctuations and economic uncertainty. When the term first came out, it was fixed with commodity such as gold. It was intervened by governments and central banks in the currency market by intentional selling and purchasing.

It is mostly selected by emerging countries because of the high cost of exchange rate fluctuations due to the lack of financial market development, lack of ability to manage exchange risk, and lack of government confidence.
Meanwhile, some argue that the fixed exchange rate system is inappropriate under the international financial environment, where capital mobility has increased significantly due to the progress of financial liberalization and globalization.

Major countries: Saudi Arabia, Hongkong, UAE, Jordan, Cuba, Qatar etc

However, the fixed exchange rate system is highly likely to be exposed to foreign exchange attacks by international speculative funds like George Soros did by betting British Pound collapse. When the fundamental of the country is deteriorated then it affects directly on the currency that leads to external currency imbalances
* The collapse of the European Monetary System (EMS) in 1993, the instability of the Hong Kong foreign exchange market in 1997, and the Asian financial crisis in 1997.

Flexible exchange rate system (or sometimes called free-floating)
It allows free exchange rate fluctuation fully affected by supply and demand of the market itself. Governments and central banks do not participate in the Forex market at all. The advantages of the floating exchange rate system as follows:

Inducing equalization
Deficit of balance of payments → demand over foreign exchange → depreciation of local currency → increase competitiveness → boost exports, decrease of imports → recovery of international balance.

Prevention to foreign exchange speculation
Free exchange rate fluctuations block foreign exchange speculation due to uncertainty about future currency movements.

Maximizing policy efforts
Because there is no limit to maintaining a certain level of exchange rate (price can be variable anytime), independent economic policies can be implemented and policy efforts can be concentrated on the balance of the domestic economy to maximize policy effectiveness.

Proper management of foreign exchange reserves 
Preventing excessive accumulation of foreign exchange reserves as central banks do not need to intervene in the foreign exchange market to defend specific exchange rate levels.

However, the concept of full free-floating exchange rate system is just theoretical. Indeed, every government or central bank intervenes in the currency market to affect the exchange rate for their advantage of trade. Some countries, such as Japan, Korea, and the United States, intervene in very little.

Managed float regime (or sometimes considered as dirty float)
Governments and central banks often seek to increase or decrease their exchange rates by buying or selling their own currencies. Exchange rates are still free to float, but governments try to influence their values. It is a fixed and variable intermediate-level exchange rate system, which limits the exchange rate fluctuation width to within a certain range (1-2.25% etc.) for a particular currency. Countries such as China choose managed float system.

Source
https://saylordotorg.github.io/text_principles-of-economics-v2.0/s33-03-exchange-rate-systems.html

Relation between country's economic growth [stock & bond market / interest rate] and currency value.

Keynesian theory
Keynesian theory introduced the concept of marginal import-oriented, explaining that if a country's economy continues to grow relatively high, it would increase imports, resulting in trade deficit and devaluation of its currency (over-demand of foreign currencies). Such external expenditure will adjust in trade balance and later on affects in the currency rate.

Global economic growth

However, as global financial market developed, things became different. If the country's economy records higher-than-expected growth, there are three factors of movements of one's currency.

Stock market
First, when the country shows how healthy its economy is, then the stock market is likely to surge. For example, after the Trump's election as 45th president of United States, the company's growth in S&P 500 stands since financial crisis 2008. Tax cut has made the company more profitable, and investors were eager to secure dollars to buy shares, funds, and securities.

Policy rates
Second, the country's market expects its interest rates to rise in the future due to an increase in confidence of its healthy economy. After taper tantrum, Janet Yellen, the former chairperson of FED, started raising up the FFR(Federal Funds Rate), which made US dollar stronger. In fact, U.S dollar was already strong as investor anticipated the FED will likely to hike the rate after austerity in QE. Investors will change their foreign currency into US dollar for their bank depository, since U.S. policy interest is higher globally.

<The more increase in FFR means the more economic growth U.S. have>

Bond investments
Third, when the economy of a country is pretty stubborn, then the government bond (or municipal bond) will probably be safe. Treasury bonds, notes and bills represent the credit of a country. In judging a country's credibility, it's important how much it grows, but it's also important how low the likelihood of bankruptcy is and how stable it is.  Asset management company such as GPIF(Government Pension Investment Fund) in Japan or Blackrock will likely to invest on safe assets such as securities which have above grade A, due to diversification of its portfolio, which will make more demand in the country's currency.
<This graph explains U.S. Dollar movements in correlation and against stock market and policy rate.> 

2020/08/16

What is exchange rate and the forms of it

What is exchange rate
Exchange rate is "the value of one currency for the purpose of conversion to another" and is moving oppositely to each other. (The price of the local currency against other currencies) When you look at the currency pair, you can see base currency and quote currency.
For example, even if Australia's growth makes AUD stronger, when USD surges relatively more than AUD, then AUD weakens as the U.S. dollar strengthens. When regarding USD as base currency and AUD as quote currency, when USD value is higher than AUD, then traders need more AUD to secure USD.
The forms of exchange rate
The forms in which foreign exchange transactions occur can be classified into two major categories: underlying transaction and speculative transactions. 
Underlying transactions contains trade transactions by world trade (service included) and international capital transactions such as FDI(including CAPEX investment, job creations, OPEX etc) or equity acquisition.  Speculative transactions occur simply to obtain trading profits. At this time, foreign exchange transactions based on trade or global capital transactions are called actual demand transactions.

Portion of total foreign exchange market
In the classical concept of foreign exchange market, trade and international capital transactions were understood as the most important causes of foreign exchange transactions, but not now. Rather, speculative foreign exchange transactions have become even more prevalent Forex markets as more countries open their financial market.
Foreign exchange transactions by trade or international capital transactions account for a very small portion. Without speculative foreign exchange transactions aimed at simple trade gains, the pricing function in the foreign exchange market would be very weak. The volume of trade and capital transactions worldwide is less than 10 percent of the total foreign exchange volume and most speculative foreign exchange transactions are heavily involved in the pricing function of the foreign exchange market.

Why is speculative transaction important and what is the role of it
The exchange rate must have a sufficient amount of supply and demand to determine the appropriate exchange rate in the foreign exchange market, which is determined purely by market function, and speculative foreign exchange transactions must exist in order to secure such demand and supply. If speculative trading is prohibited and only underlying transactions are made on demand, the size of the market will not reach a certain level and as a result, the foreign exchange market's exchange rate may be distorted or the exchange rate-setting function may be lost.
For example, lets presume that only underlying transaction is on demand. When the demand of dollar is 2 million and supply is only 1 million, the currency rate will soar up in need for more supply, which will make Forex in extreme volatility.  However, when speculative transaction is traded actively, then the supply problem will be hugely diminished.

Above all, speculative trading serves to provide liquidity in the foreign exchange market by creating a sufficient supply of demand in the foreign exchange market and is a very key role.

Foreign exchange exposure and risk for trading companies and investors.

DXY (U.S Dollar Index - Bloomberg) has sharply risen until 102.82 points in March 20th this year, which made S&P 500 historic low down to 2,237.40 points after Trump's election as 45th president of United States (Dec, 2016). USD to KRW (European Term*) exchange rate hits 1,296 won, highest in 11 years.
European Term: USD is always the base currency in currency pair. (USD/JPY=106.56, USD/HKD=7.75) 
American Term: USD is always the quote(counter) currency in currency pair. (NZD/USD=0.75, EUR/USD=1.11)
[It is due to express the same way of indicating the price of the product. 1 cheese = USD 2.50)
Foreign exchange exposure and foreign exchange risk always have been in danger for trading companies, investors and financial institutions who invest abroad. I will explain the exchange risk with the example of a trading companies in Korea, because Korean companies react most sensitively to the economic cycle and exchange rates.

There are usually two kinds of business in trading companies: import and export.
Importing company: It is different to buy the same 10 USD item for 10,000 KRW and 13,000 KRW. Purchasing in 10,000 KRW is 23.1% more profitable because of a rise in Korean currency value. (Rise of value in the currency means an increase in purchasing power. For import-specialized companies, the actual fall in the USD/KRW exchange rate is more beneficial than the contractual rate.
Exporting company: The company A is trying to sell the product at a 10% of operating profit. However, its profit becomes 3 percent if USD to KRW currency rate drops at 7 percent. (Which means KRW became stronger). Meanwhile, if company B is trying to export at a low margin of 1% due to the contract, but if KRW weakens by 7%, then it will make more 8% of the profit.

This circumstance seems not to take place, but it does happen frequently like the precedent explains when COVID-19 spreads all over the world.

To sum up, the fall of currency exchange rate from USD to KRW would benefit importers and harm exporters. On the contrary, rising exchange rates are good for exporters and damage importer's profit. However, it is impossible to predict the direction of exchange rate. (Only God knows) Nevertheless, exporters and importers should always prepared to manage the downside and upside risks of the exchange rate.

Source 1: Coronavirus Map: Tracking the Global Outbreak (New York Times)
https://www.nytimes.com/interactive/2020/world/coronavirus-maps.html

Source 2: Quote Currency Definition
https://www.investopedia.com/terms/q/quotecurrency.asp#:~:text=Key%20Takeaways-,The%20quote%20currency%2C%20commonly%20known%20as%20%22counter%20currency%2C%22,currency%20is%20the%20domestic%20currency.

2020/08/14

What is Carry Trade?

Definition
The definition of carry trade from Investopedia is a trading strategy that involves borrowing at a low-interest rate and investing in an asset that provides a higher rate of return. It is typically based on borrowing in a low-interest rate currency and converting the borrowed amount into another currency.

The Risk of Carry Trade
1. When the invested assets are declining sharply in price, carry trade investors should take risk.
2. Currency risk of invested currency will later be a burden. When the invested currency value tumbles, investor would have more deficit even thought the interest rates (rewards) are higher.

Japan is the best example of carry trade investment. Since natural disaster such as earthquake or typhoon is occurred frequently in Japan, indemnity insurance companies are obliged to compensate the losses. That is why Japanese investors were seeking for more gains, which later lead to FDI (Foreign Direct Investment) or foreign bonds. Recently, Japan is the largest net creditor country is the world. However, this kind of investment can negatively affect the economy.

For example, Japanese yen had reached about $1 trillion of carry trade investment due to its long low policy rate. However, when the global economy strikes to recession during 2008 financial crisis, the invested asset value was deteriorated. Japan started to sell off the foreign assets which is making Japanese Yen soars high.

It also happened during the worst earthquake (Kobe) in January 1995. Japanese Yen has tumbled until 1USD = 80JPY, due to withdrawal against carry trade investment. It was only 5 years after Japanese asset price bubble blasted, Japan had the worst domestic economy, troubled with insolvent assets. However, due to strong Japanese currency value, their exported started tumbling, making their economy go even worse. About 4 months later, Japan agreed to have anti-Plaza agreements, leaving Japanese Yen weakening its value.
(South Korea attempted to expand more on Capex investment since Japan had hard time with high JPY. They might have took it as great opportunity for their export. Unexpected anti-Plaza accord was one of the reason that lead South Korea in currency crisis.)

2020/08/13

What is the 'Dollar's Smile'?

Brief explanation about Dollar's Smile.
U.S dollar tends to increase in value when the world economy is extremely weak or U.S economy becomes exceptionally stronger than other countries.
Suppose that there is a straight line. Two factors I mentioned above are at the end of the line which drags it upwards. Then the middle point would be relatively low which makes the figure looks like a smile. Let me give you three examples that influence on the moves of U.S Dollars.

1. When the U.S. economy is weak.
During the lowest bottom of real economy when the number of COVID-19 confirmed cases has spread, US Dollars became relatively stronger than other currencies. It is due to the increase in investors who are looking for the safest securities. Secured assets are mostly in U.S, so investors borrow or exchange into the dollars. Dollar's value surge up consequently. In extremely worst cases, investors withdraw cash from the safest assets such as U.S treasuries, which makes currency precious. (Cash is very important to compensate margin for leveraged loans. Margin calls are the most frightening signals for investor in risk of liquidation from investment bank.)

2. When U.S economy is stronger than other countries.
In fact, there are two cases that drive demand for U.S dollars. First, when U.S stock index rallies, investors all around the world will try to borrow dollars to buy the risky assets. When the economy overheats, FED will likely to increase FFR (Federal Funds Rate), which will look treasury bond attractive as yield increases. (Chance to buy bonds at relatively cheaper price) Recent days during FOMC, Fed announced to remain interest rate low until the inflation rate overshoots above 2% target.

3. When global growth especially on emerging countries strengthens.
Investors are on risk-on mode during the season when growth on global market boosts. Investors will look for more risky assets to have more capital gains and profits. Investors will sell safe-haven assets such as treasuries (bond, note, and bills) and exchange into risk currencies.

FYI: US dollar becomes strong during recession in US for two reasons.
1. When U.S consumption economy drop, then their import drops. This will lead to trade deficit drop. Supply of Dollar will drop which affects surge in USD.
2. U.S banks or financial institution will secure cash, which will lead to damage on carry trade investment. (In case of bank run) When U.S withdraws cash, then USD will be stronger. Other countries will suffer due to foreign exchange outflow.

Source 1: What Is the Dollar’s ‘Smile’?
https://www.wsj.com/articles/what-is-the-dollars-smile-11591539293#:~:text=The%20dollar%20smile%20is%20a,the%20smile%20on%20your%20face.

Source 2: Fed’s Kaplan Open to Overshooting Inflation Target to Provide More Support
https://www.wsj.com/articles/feds-kaplan-open-to-overshooting-inflation-target-to-provide-more-support-11594995860

2020/08/10

The difference between Coupon Bond & Discount Bond / Investment-grade Bond & Speculative-grade Bond

Bonds are loans issued by the government, public organizations, and corporations to borrow relatively large amounts of cash from people. The most common types of bonds include treasury bonds, municipal bonds and corporate bonds.

The difference from stocks is that bond has maturity and interest, like bank deposits and savings. Stocks pay dividends to shareholders instead of interest, and there is no specific maturity date. Bonds are typically put importance on how it is safe and never be in a risky of bankruptcy rather than the fundamental of growth.

Bonds can be divided into two categories depending on the way interest is paid.
Coupon bond: A bond that pays interest every specific period. Depending on the bond, interest may be paid every three months, annually, or monthly.

Discount Bond: Unlike coupon bonds, discount bonds do not have interest(yield). Another word for discount bond is zero-coupon bond. Discount bonds are literally 'discounted' when issued and promise to buy them back at a higher price later. If issuer buys back later as promised, bond-holders will be able to profit from discount bond.

For example, if the purchaser promises to buy a discount bond issued at 9 million USD for 10 million USD after 3 years, the 3-year yield total will be 11.11% and the 1-year yield will be around 3.7%. From the issuer's point of view, they tend to issue discount bonds because they are burdensome to pay interest on a regular basis.
Discount bonds are a bit burdensome for purchasers who buy bonds. They will have to wait until the expiration. These days, it is said to issue coupon bonds to attract investors.

Bonds can be divided into 4 categories depending on where they are issued. There are treasuries (bill, note, bond, TIPS - government bonds) issued by the government, municipal bonds issued by local governments, bank bonds issued by financial institutions such as banks, and corporate bonds issued by companies such as corporations.

Moreover, there are two types of grades of the bonds.
Investment-grade: These bonds have a higher credit rating, implying less credit risk, than high-yield corporate bonds. (Over BBB- ratings)
Speculative-grade (High-yield): These bonds have a lower credit rating, implying higher credit risk, than investment-grade bonds and, therefore, offer higher interest rates in return for the increased risk. (Under BBB- ratings)
Mostly, companies with low credit ratings issue bonds, interest rates are high. There's a risk of failing to pay back as much as the credit rating is low, so it raises interest rates even more.
Source: Investor.gov
https://www.investor.gov/introduction-investing/investing-basics/investment-products/bonds-or-fixed-income-products/bonds#:~:text=Corporate%20bonds%20are%20debt%20securities,than%20high%2Dyield%20corporate%20bonds.